Thursday, September 22, 2011

Yes, Monetary Policy is Important!

That's what markets are screaming right now. If monetary policy was out of bullets, the markets wouldn't react to a disappointing Fed meeting.

As I said previously,

Any kind of a long term anchor (explicit NGDP/CPI targeting) or adjustable policy (changing IOR or asset purchases monthly based on the latest data) will be more effective  than ambiguous and rigid policies (QE2, keeping the Fed Funds rate at 0% for "an extended period of time")

"Operation Twist" is even worse than QE2 or commitments to keep the Fed funds rate at 0%. Is it any wonder stocks, commodities, interest rates, and inflation expectations are plummeting?

We are in scary territory.

Why Yesterday's Meeting was so Disasspointing

Here's the full statement

Markets were hoping for lower interest on reserves, or a mention of other policies the Fed could enact at a future date. Instead, they got a policy most agree was previously ineffective and a very negative outlook about the economy, implying the Fed isn't willing to take the necessary steps to boost aggregate demand.

Tuesday, September 13, 2011

Krugman's double standard

Paul Krugman writes that even though monetary policy can work in theory, it won't work in practice

Now, in principle you can get traction by making money a less attractive store of value. In particular, if you can credibly promise future inflation, that will make the real return on money negative. But getting that kind of credibility is tricky, especially given the normal prejudices of central bankers.

The problem with this analysis is that it seems to imply that his preferred alternative, fiscal policy, does not have such issues. It does. Krugman himself admits policymakers won't ever do enough fiscal stimulus unless a world war breaks out (and that includes periods where all three branches of the government are controlled by democrats), so what is the advantage of fiscal stimulus then? It's much costlier, less proven, and even less likely than a commitment to inflation. Krugman simply isn't doing his job as a pundit if he's going to brush away monetary policy while continuing to advocate fiscal policy.

In addition, every believer in current fiscal stimulus should mention the low 2% implicit inflation targets as one of the largest policy mistakes leading up to the recession. If you really do believe that monetary policy only works through changes in short term interest rates, raising the inflation target to 4% is a virtually costless way to make monetary policy more effective. For reasons I can't explain, I have never seen this incredibly obvious implication of the liquidity trap argument made. They should be screaming it from the rooftops.

Fiscal policy is inferior from both practical and theoretical perspectives. Why advocate it and not monetary policy then?

Wednesday, August 10, 2011

Money Is Now As "Easy" As It Was During The Great Depression!


The Ten year is currently yielding 2.09%.

The only difference is in the Great Depression was caused by a collapse in the money supply while the current recession is the result of a massive increase in the demand for cash.  The results are the exact same (although much less severe this time).

Tuesday, August 9, 2011

Market Reaction To FOMC Announcement


(Before data was taken at 2:00 pm, After data was recorded at market closing prices)

S&P 500
Before : 1138.64
After : 1172.53

Treasuries
2 year
Before : 0.27
After : 0.20
10 Year
Before : 2.33
After : 2.26
30 Year
Before : 3.68
After : 3.64


Inflation Expectations
2 year inflation swaps
Before : 1.43
After : 1.39

5 Year TIPS Breakeven rate
Before : 1.81
After : 1.78

10 Year TIPS spread
Before : 2.27
After : 2.22

30 Year TIPS spread
Before : 2.64
After : 2.61


Bloomberg Commodity Index
Before : 1601.42
After : 1598.48


EUR USD
Before : 1.4221
After : 1.4339


(Data from bloomberg.com)


The market reaction to the Fed announcement today was certainly interesting. Fed Funds Futures unsurprisingly fell in reaction to the commitment to leave them at 0% until 2013. Equities took a while to figure out how they felt, seesawing up and down before finally rising about 3% from their pre-meeting rallies. Treasury yields fell, especially at the medium end of the curve (only because the short end can't fall any further). Inflation expectations also fell slightly as well, along with commodities and the dollar. 

Personally I think the Fed announcement was underwhelming. Committing (whether loosely or strictly, no one really knows how serious they are about this commitment, or even whether it is a commitment at all - are they simply predicting they will need to do this?) to leaving rates at 2013 is another way of telling us that they predict a significant output gap will remain at least until then and won't take the necessary actions to do anything about it. Is there anyone who isn't thinking about Japan now?

The dissents are puzzling... if 3 members are going to dissent, why not do something more like lower interest on reserves? Maybe they would have had even more dissents if they did, if so, we are in serious trouble... if not, they obviously should have tried more. Christina Romer said the dissents might be a sign Bernanke is now more willing to work without unanimous approval of policies, but why not do more right now?


I don't blame markets for their "confusion"... I'm not really sure how to read this either. It was certainly better than nothing, but not much better. Much more stimulus is needed. Still, today once again demonstrated that markets don't buy either liquidity trap or easy money stories.

Monday, August 8, 2011

Debt Problems Are All About Insufficient Aggregate Demand

Look at this chart comparing Debt to NGDP...


It's pretty obvious that had NGDP been allowed to continue its trend growth, the US government debt burden would be significantly lower. Of course, raising NGDP by unexpectedly inflating is always an option (and always a bad one), but we are talking about continuing a trend that was the implicit goal of the Fed for the previous 20 years!

And remember, Lower NGDP resulted in lower real GDP as well. This increased government debt burden far beyond what the decline in NGDP relative to debt implies. Had NGDP continued to grow at trend, its reasonable to assume public debt would be closer to $7.6 trillion than $9.6 trillion.


Assuming NGDP stayed on trend (but debt still rose to $9.6 trillion), Debt/GDP would be 56% rather than 64%. Under a more plausible scenario, debt would have grown more slowly had NGDP stayed on trend and Debt/GDP would be even lower at ~44%.

Obviously entitlements are the biggest problem in the long run, and I think S&P was incorrect in downgrading the credit rating of the US, but this recession has still needlessly and dramatically increased our debt burden. Any true deficit hawk should be screaming for easier monetary policy.

Saturday, August 6, 2011

The Disaster That Is Federal Reserve policy.

Tim Duy nicely sums up how incompetent Fed policy has been over the past few years.
Bottom Line:  The market nosedive does not yet guarantee Fed action in the near future.  History has shown the Fed tends to react with a lag.  They should have learned better by now, but if they had learned anything, they would not have pushed forward with hawkish rhetoric earlier this year.  Arguably, they will hold firm, let the markets think they are out of the game and further bid down implied inflation expectations, and then, once the damage is done, up the level of stimulus.  Terrible way to run an economy, I know.
I think this is exactly right, and it shows how misguided the Fed is right now. If the Fed is looking at market inflation expectations (and they have made it clear they are) they seem to be forgetting that those expectations have expected monetary policy built into them. To the extent that expectations deviate from the Fed's implicit goal (2-3%), they already represent policy failure.

To use a "Sumnerian" analogy, it would be like the captain of the Titanic looking at market expectations of their eventual destination and saying "Expectations say we'll be in New York City on time, looks like my job is done!", without realizing those expectations exist because he is expected to appropriately react to changing conditions (and avoid icebergs!).

It's actually worse than this though, because the Fed will never make up for "lost" NGDP growth. They've already made it quite clear they aren't comfortable with inflation above ~2% under any circumstances, and so we are left with a permanently lower NGDP and 
price level trend.

To put this into perspective, in 2008, when the financial crisis began, a good guess for 2018 NGDP would have been about $26 trillion. Right now, even if we get 5% NGDP from this point forward it will be just over $22 trillion! Over the course of a decade this will have added up to a $27 trillion* difference in nominal income! Too bad for anyone paying wage contracts, but at least employees got a nice real wage boost! And sure, it hurts debtors, but investors have done fantastically! 
You may detect a hint of sarcasm. So much for the "trade offs" of inflation/deflation between creditors and debtors that some are pushing.

* I originally mistakenly wrote it would result in a $105 trillion difference because I forgot I was dealing with quarterly annualized numbers.

Thursday, August 4, 2011

Fed Funds and Aggregate Demand 8/4/2011


S&P 500
May 11 : 1342.08
June 8 : 1279.56
July 7 : 1353.22
August 4 : 1200.07

Treasuries
2 year
May 11 : 0.55
June 8 : 0.38
July 7 : 0.47
August 4 : 0.26

10 Year
May 11 : 3.18
June 8 : 2.94
July 7 : 3.16
August 4 : 2.42

30 Year
May 11 : 4.29
June 8 : 4.19
July 7 : 4.38
August 4 : 3.69

Inflation Expectations
2 year inflation swaps
May 11 : 2.16
June 8 : 2.01
July 7 : 1.92
August 4 : 1.65
5 Year TIPS Breakeven rate
May 11 : 2.19
June 8 : 2.02
July 7 : 2.10
August 4 : 1.79
10 Year TIPS spread
May 11 : 2.42
June 8 : 2.27
July 7 : 2.49
August 4 : 2.22
30 Year TIPS spread
May 11 : 2.53
June 8 : 2.45
July 7 : 2.67
August 4 : 2.58

Bloomberg Commodity Index
May 11 : 1672.35
June 8 : 1713.68
July 7 : 1717.93
August 4 : 1660.55

EUR USD
May 11 : 1.4249
June 8 : 1.4577
July 7 : 1.4351
August 4 : 1.4105

(Data from bloomberg.com)

Expectations have fallen dramatically the last couple weeks. Fed intervention of some kind is likely, but we still don't exactly know what the Fed's goal is. Will they react to past inflation rates? Commodities? Job growth? Financial markets? Inflation expectations? Only the FOMC knows. We also don't know how they'll intervene exactly. Hopefully they'll try something more flexible than QE2 was.

Here are predictions I made a couple of months ago. I think they've held up pretty well. The only thing I was off on was underestimating the importance of Europe's debt troubles. Although Europe's woes are also caused by tight money (the European Central Bank seems more concerned with what's good for Germany than what's good for Europe as a whole), there's no reason they should be lowering U.S. NGDP unless the Fed doesn't respond to higher dollar demand... but the Fed isn't responding (at least not until things get really bad), so Europe's woes are lowering U.S. NGDP.

Wednesday, July 13, 2011

No Surprises Here - Let's Hope Bernanke Has Learned His Lesson

Stocks, commodities and long term bond yields all rose in response to Bernanke's testimony today. Expected fed funds rates fell, which suggests any more stimulus is more about postponing tightening than anything else.

If the Fed does need to engage in additional asset purchases (and I think it's extremely likely it will) it should use more flexible policies than it did in QE2. Instead of announcing in advance it will purchase $X in bonds over a certain time period, the Fed should purchase or sell (if the economy improves rapidly) as many bonds as it needs on a month to month basis in response to changing economic circumstances. This would allow them to seamlessly transition between tightening and easing as if they were controlling the fed funds rate.

Better late than never...

Friday, July 8, 2011

"The trade-offs (between growth and inflation) are getting less attractive at this point."

That was Bernanke during his April 27th press conference. What's happened since then?


Even if Bernanke was correct then, it seems clear that the trade-offs are once again incredibly attractive.

Thursday, June 30, 2011

Fed Funds and Aggregate Demand 6/30/2011


S&P 500
April 27 : 1357
May 26 : 1325.69
June 22 : 1287.14
June 30 : 1320.64

Treasuries
2 year
April 27: 0.64
May 26 : 0.48
June 22 : 0.36
June 30 : 0.45
10 Year
April 27 : 3.35
May 26 : 3.06
June 22 : 2.96
June 30 : 3.15
30 Year
April 27 : 4.45
May 26 : 4.22
June 22 : 4.19
June 30 : 4.36

Inflation Expectations
2 year inflation swaps
April 27 : 2.65
May 26 : 2.12
June 22 : 1.83
June 30 : 1.84
5 Year TIPS Breakeven rate
April 27 : 2.35
May 26 : 2.07
June 22 : 1.89
June 30 : 2.03
10 Year TIPS spread
April 27 : 2.60
May 26 : 2.34
June 22 : 2.24
June 30 : 2.48
30 Year TIPS spread
April 27 : 2.68
May 26 : 2.47
June 22 : 2.39
June 30 : 2.65

Bloomberg Commodity Index
April 27 : 1766.98
May 26 : 1684.28
June 22 : 1665.53
June 30 : 1667.7

EUR USD
April 27 : 1.4738
May 26 : 1.4129
June 22 : 1.4268
June 30 : 1.4496

(Data from bloomberg.com)

The potential resolution of the Greece crisis pushed markets in a positive direction this week. European debt problems could have potentially caused a flight from Euros into Dollars and since a higher demand for dollars could only have been offset by a larger supply, this would have required fed action... and we know how hesitant they are to act at a 0% fed funds rate.

If the economy can avoid any negative shocks the Fed might be able to get by without actions stimulus, but the recovery will likely continue at a "frustratingly slow pace" (to borrow a phrase from Bernanke) unless the Fed becomes willing to "put up with" higher NGDP growth.

One could put a positive spin on current events by pointing out that inflation pressures are non-existent and another commodity boom seems unlikely (given that the "boom" last year really just returned prices to pre-crisis levels). Year over year inflation should fall and it will be harder for inflation hawks to argue for tighter money under this scenario.

The problem with that argument is that the Fed already knows these things and still can't agree that money is too tight. The Fed has also shown how eager it is to tighten if things get even marginally better. I hope I'm wrong.

Tuesday, June 28, 2011

Billion Prices Project vs QE2

The Billion Prices Project uses online data to measure prices on a daily basis. Their results  closely follow non-seasonally adjusted CPI.

You can see the important influence commodity prices have had on CPI, but seeing as how those were, at least partially, a result of QE2* and still don't fully explain the rise in prices after QE2 I see this graph as another strong piece of evidence that QE2 worked.

I expect price increases to continue to moderate in the future. The economy still can benefit greatly from more aggregate demand.

*Commodity price increases as a result of higher world aggregate demand (QE2) are reflecting something good, price increases as a result of supply shocks (Libya) are bad.  This is economics 101 but it is still very often misunderstood.

Friday, June 24, 2011

Fed Funds and Aggregate Demand Watch 6/22/2011


S&P 500
April 27 : 1357
May 26 : 1325.69
June 15 : 1265.42
June 22 : 1287.14

Treasuries
2 year
April 27: 0.64
May 26 : 0.48
June 15 : 0.38
June 22 : 0.36
10 Year
April 27 : 3.35
May 26 : 3.06
June 15 : 2.97
June 22 : 2.96
30 Year
April 27 : 4.45
May 26 : 4.22
June 15 : 4.20
June 22 : 4.19

Inflation Expectations
2 year inflation swaps
April 27 : 2.65
May 26 : 2.12
June 15 : 2.00
June 22 : 1.83
5 Year TIPS Breakeven rate
April 27 : 2.35
May 26 : 2.07
June 15 : 2.01
June 22 : 1.89
10 Year TIPS spread
April 27 : 2.6
May 26 : 2.34
June 15 : 2.29
June 22 : 2.24
30 Year TIPS spread
April 27 : 2.68
May 26 : 2.47
June 15 : 2.44
June 22 : 2.39

Bloomberg Commodity Index
April 27 : 1766.98
May 26 : 1684.28
June 15 : 1674.20
June 22 : 1665.53

EUR USD
April 27 : 1.4738
May 26 : 1.4129
June 15 : 1.4172
June 22 : 1.4268

(Data from bloomberg.com)

Expectations for aggregate demand continue to slowly deteriorate as the Fed maintains a "neutral" policy. 

Monday, June 20, 2011

QE2 and the Economy

QE2 clearly impacted asset prices, but how was the actual economy affected? 

It should be noted that the recovery had basically lost all momentum in the summer of 2010 and that claims that the economy was "already on the road to recovery" before QE2 seem questionable, especially given the impact QE2 seemed to have on asset markets.

Starting with employment:

\


Employment based on the Establishment Survey (the survey used to measure month to month changes in employment) clearly did better during the "QE2 period" than during the period before QE2. If employment growth continues at a 150,000+ pace over the next couple months this may just be momentum but if it remains weak (and I predict it will) it seems pretty clear QE2 positively affected employment growth.


The Household Survey (The survey used to measure unemployment) basically gives the same result. Simply put, the only time we've had adequate employment growth since the recession was during the period of QE2.


Since unemployment claims are measured on a weekly basis they provide a somewhat clearer picture of the impact of QE2 on employment. Unemployment claims sharply refute the claim that things were improving without QE2 (notice the "flatness" of claims from late 2009 to mid 2010) or that QE2 didn't help stimulate aggregate demand. This, along with the other employment data seem to strongly suggest QE2 positively affected the employment situation.


It's much harder to argue the turnaround in consumer credit was the continuation of the recovery before QE2. Consumer credit clearly fell until QE2 was hinted at and it started rising steadily immediately afterwards.


Both ISM surveys give the same basic result; the economy slowly gained momentum from late 2008 to early 2010 when it began to stall until QE2 began.


Industrial production is somewhat less clear, but it too seems to have slowed to a crawl in 2010 until a few months after QE2 began. It should once again be noted that economic expectations fell off a cliff before QE2 (very similar to the way they have today), so even a continuation of the previous trend is a success of some kind.


At no point since the recession did retail and auto sales grow so consistently and so strongly than they did during the "QE2 period". Also note the drop-off since QE2 effectively ended.
It will be interesting to see how data turns out the next few months. The weaker it is, the stronger the evidence that QE2 was effective. 

In summary : The evidence that QE2 worked is enormous, but it wasn't enough. If the fed engages in further asset purchases, it should include an explicit target (inflation, NGDP) and should adjust their size according to changes in the performance of the economy.

Wednesday, June 15, 2011

How QE2's Announcement and Premature End Affected Asset Prices

Firstly, let me justify the beginning and end dates for QE2.

I consider August 27, 2010 to be the effective beginning of QE2. On this day Bernanke delivered the Jackson Hole speech in which he first hinted at another round of quantitative easing for the purpose of stimulating aggregate demand.

I consider April 27, 2011 to be the effective end of QE2 (although it would be more accurate to say "the end of any chance for additional easing of any kind unless things get much much worse"). The key quote by Bernanke was this :

“The trade-offs are getting — are getting less attractive at this point. Inflation has gotten higher. Inflation expectations are a bit higher. It’s not clear that we can get substantial improvements in payrolls without some additional inflation risk."

He hasn't given any indication he has changed his mind since, or that he plans to pursue any other form of easing.

Now that you know where I'm coming from, let's look at some asset prices!


No form of assets responded more clearly to the announcement and effective end of QE2 than equities did. Higher equity prices reflect better economic expectations and those expectations can become a self fulfilling prophecy through Tobin's q and wealth effects. Perhaps more importantly, higher stock prices also partially reflect a lower demand for dollars and that decreased demand immediately increases nominal spending. Also note the fall after QE2's "end".


Similarly, inflation expectations seem to have been strongly influenced by QE2's announcement. Again note the fall since QE2's end.


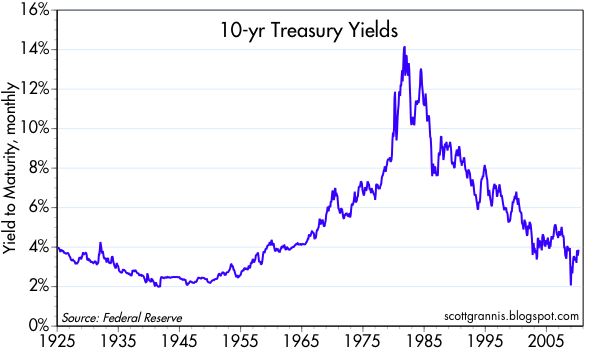
Treasury yields also noticeably rose in response to QE2. Many have pointed out that QE2 was supposed to reduce yields and have pointed to their rise as evidence against QE2's effectiveness (ignoring equity prices and inflation expectations), but higher yields were actually reflecting higher inflation real growth expectations. As Milton Friedman and Frederick Mishkin have pointed out, interest rates are NOT a reliable indicator of monetary policy and low interest rates can (and do) signal that money is tight. Higher interest rates usually reflect a healthier economy when rates are this low. Unsurprisingly, the lower rates of the past month have been associated with worsening economic conditions.


Finally, the dollar has almost certainly fallen as a result to QE2. A falling dollar can be a bad sign if it is associated with high inflation (or supply side issues), but high inflation is still not a concern. In this case, a falling dollar helped increase net exports (by cheapening domestic goods) and as reflected less dollar hoarding (which is associated with lower V and more NGDP at any given supply of money). And once again, just as any prospects for additional easing ended the dollar began to rise.

Several excellent economists including John Cochran and James Hamilton have expressed doubts about the effectiveness of QE2. It's true that from a purely mechanical perspective, QE2 was likely irrelevant. So why the impact on markets?

The most likely explanation is that QE2 impacted medium term (2-10 years in the future) NGDP expectations. Anything the Fed can do to convince people that they will push for a higher NGDP in the future will improve expectations. Improved expectations have immediate effects on NGDP as they raise expected inflation/real growth and reduce the demand for dollars (thereby increasing V) today.

If this is the case, why does the Fed seem so uncomfortable with higher future NGDP? I think it's mostly a year over year % change issue versus a level targeting one. The Fed is worried that even temporarily higher rates of inflation and NGDP growth (to catch up to past trends) will be hard to push back down. That would be reasonable if expected inflation was above 3%, but at barely 2% these concerns are completely unjustified. The Fed is also likely concerned about bubbles, but with unemployment at 9% and a tremendous amount of slack in the economy, those concerns need much more justification and evidence backing them before they can be legitimately used to prevent easier policy.

(Half way through creating this post I saw that Marcus Nunes beat me to it and posted something very similar. He makes somewhat different -- although equally valid -- points)

In the next few days I'll post something similar regarding the impact of QE2 on economic data.

Fed Funds and Aggregate Demand Watch 6/15/2011


S&P 500
April 27 : 1357
May 26 : 1325.69
June 8 : 1279.56
June 15 : 1265.42

Treasuries
2 year
April 27: 0.64
May 26 : 0.48
June 8 : 0.38
June 15 : 0.38
10 Year
April 27 : 3.35
May 26 : 3.06
June 8 : 2.94
June 15 : 2.97
30 Year
April 27 : 4.45
May 26 : 4.22
June 8 : 4.19
June 15 : 4.20

Inflation Expectations
2 year inflation swaps
April 27 : 2.65
May 26 : 2.12
June 8 : 2.01
June 15 : 2.00
5 Year TIPS Breakeven rate
April 27 : 2.35
May 26 : 2.07
June 8 : 2.02
June 15 : 2.01
10 Year TIPS spread
April 27 : 2.6
May 26 : 2.34
June 8 : 2.27
June 15 : 2.29
30 Year TIPS spread
April 27 : 2.68
May 26 : 2.47
June 8 : 2.45
June 15 : 2.44

Bloomberg Commodity Index
April 27 : 1766.98
May 26 : 1684.28
June 8 : 1713.68
June 15 : 1674.20

EUR USD
April 27 : 1.4738
May 26 : 1.4129
June 8 : 1.4577
June 15 : 1.4172

(Data from bloomberg.com)

Thanks to the beating stocks took today, data were once again mixed compared to last week. Stocks and commodities are signaling lower aggregate demand expectations, while the Euro/Dollar exchange rate and federal funds futures are signaling higher expectations. Despite a better than expected retail sales number (which was still negative), economic data has continued to disappoint. At this point, I consider "mixed" markets good news.